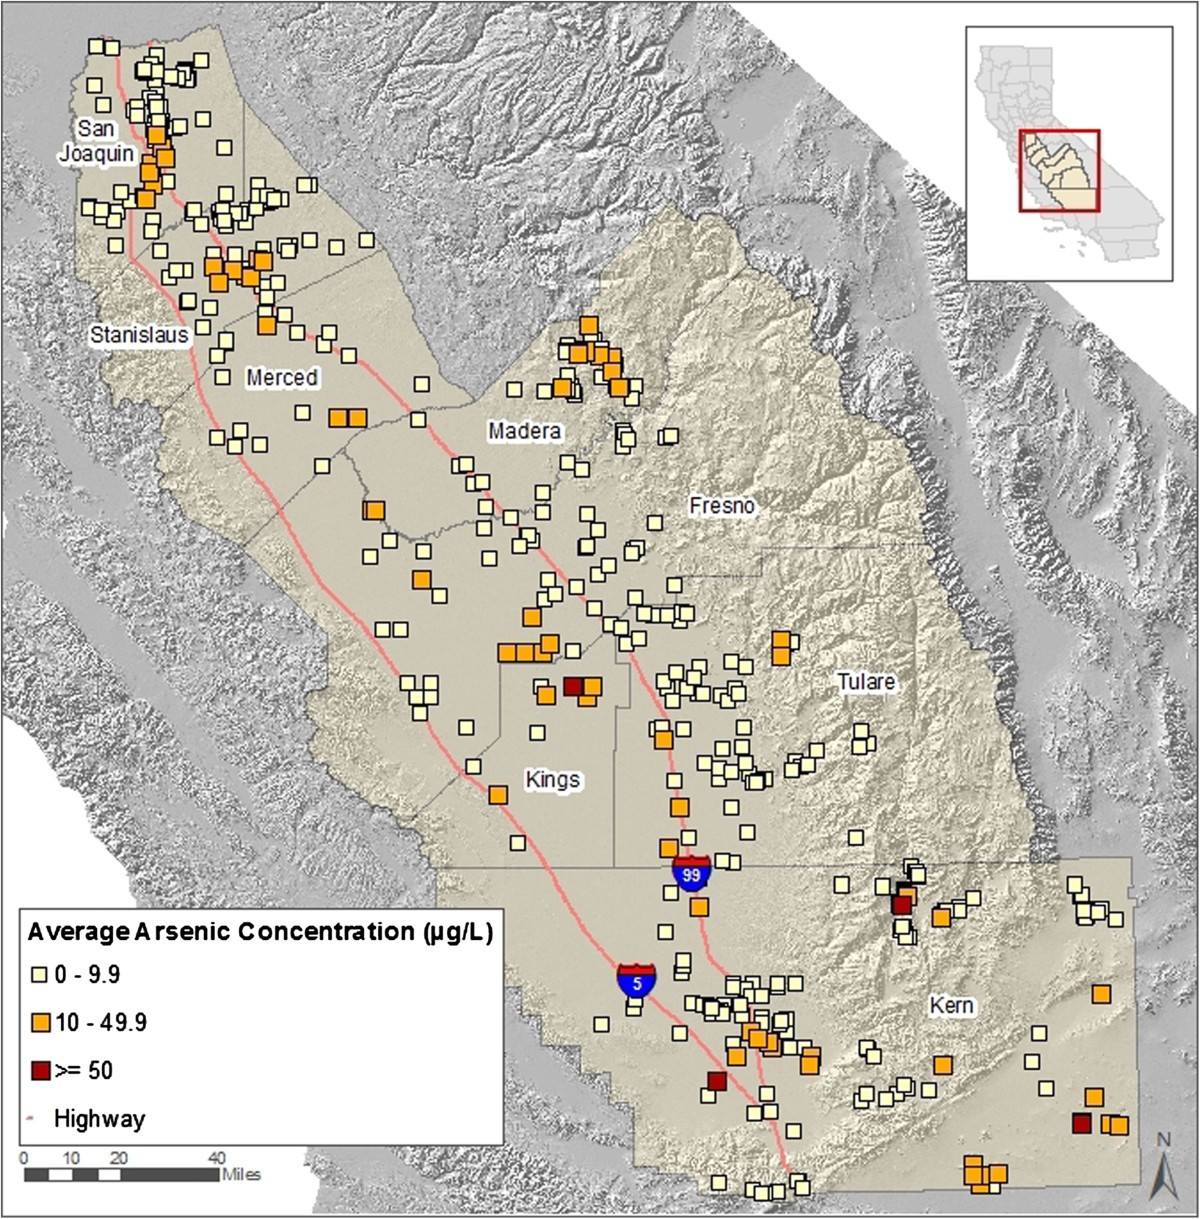
Figure 1

Average arsenic concentration a of community water systems (CWS b,c ) in study sample, (n = 464), 2005–2007. a Estimate based on average of each point-of-entry source’s average concentration; b Sources of data: CDPH Water Quality Monitoring and PICME databases (CDPH 2008a,b); c Approximate location of CWSs are depicted, but not true boundaries. Due to close proximity of some CWSs, map partially covers some CWSs.
