Table 3 Distribution of total (all sources) individual exposure at different places and times in a Swiss study sample (partly reprinted from [15]).
Arithm. mean | Minimum | 5% quantile | 25% quantile | Median | 75% quantile | 95% quantile | Maximum | |
|---|---|---|---|---|---|---|---|---|
Average (mW/m 2 ) | 0.134 | 0.014 | 0.030 | 0.054 | 0.092 | 0.163 | 0.351 | 0.881 |
- Daytime | 0.164 | 0.014 | 0.034 | 0.070 | 0.127 | 0.209 | 0.445 | 1.063 |
- Nighttime | 0.076 | 0.003 | 0.005 | 0.014 | 0.028 | 0.086 | 0.245 | 1.367 |
- Workday | 0.134 | 0.013 | 0.027 | 0.055 | 0.096 | 0.170 | 0.353 | 0.776 |
- Weekend | 0.133 | 0.007 | 0.014 | 0.031 | 0.064 | 0.148 | 0.474 | 1.243 |
Time above 1 V/m (%) | 0.453 | 0.016 | 0.046 | 0.134 | 0.255 | 0.509 | 1.201 | 8.442 |
- Daytime | 0.629 | 0.000 | 0.038 | 0.174 | 0.359 | 0.697 | 1.988 | 8.754 |
- Nighttime | 0.083 | 0.000 | 0.000 | 0.000 | 0.000 | 0.072 | 0.313 | 2.101 |
- Workday | 0.447 | 0.000 | 0.036 | 0.127 | 0.254 | 0.500 | 1.409 | 5.836 |
- Weekend | 0.458 | 0.000 | 0.000 | 0.052 | 0.157 | 0.365 | 1.714 | 14.958 |
Rate of change (mW/m 2 ) 1 | 0.128 | 0.011 | 0.025 | 0.060 | 0.102 | 0.172 | 0.299 | 0.484 |
- Daytime | 0.181 | 0.004 | 0.018 | 0.062 | 0.170 | 0.260 | 0.430 | 0.590 |
- Nighttime | 0.037 | 0.000 | 0.000 | 0.002 | 0.006 | 0.021 | 0.237 | 0.351 |
- Workday | 0.133 | 0.003 | 0.018 | 0.048 | 0.117 | 0.191 | 0.328 | 0.480 |
- Weekend | 0.117 | 0.000 | 0.004 | 0.018 | 0.054 | 0.189 | 0.413 | 0.812 |
-
1
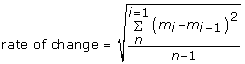 ; m = measurement
 ; m = measurement